Translation Tool

Friday, July 30, 2010

S&P 500: Targets the April high while key 14-day MA supports


Entering 2010, the S&P 500 Index was in the process of completing impulsive strength off the March 2009 low. Since underperforming the 200-day MA by a record 36%, price-action has since oscillated in a narrow band around the 200-day MA. Key medium-term turning points have each been preceded by divergences between price and daily MACD. A shift in trend, however, was not confirmed until price-action had managed to clear the important 14-day MA.

The 5-wave decline off the April peak stalled in early July despite breaking below a broad Head & Shoulder's neckline and impending fears of the so called “death cross.” It was then that various measures of breadth hinted of a selling climax. More importantly, RSI had reached oversold levels not seen since the panic lows of spring '09. The knee-jerk recovery has now extended back above the 200-day MA and has subsequently held 14-day MA support. As such, there is additional room for current strength to retest the April highs given the lack of daily MACD divergence and that RSI remains comfortably below overbought levels. In addition, S&P 500 futures indicate a lack of hourly divergence suggesting robust short-term momentum. On the other hand, if the current rally manages to close below the 14-day MA (now at 1095), the recovery would be at risk of exhausting and could suggest that the latest move is a corrective zig-zag rather than a possible 5-wave progression.
STRATEGY: Buy S&P 500 futures at market risking 1087, targeting 1217




Thursday, July 29, 2010

EUR: Closing in on a key Fibonacci retracement


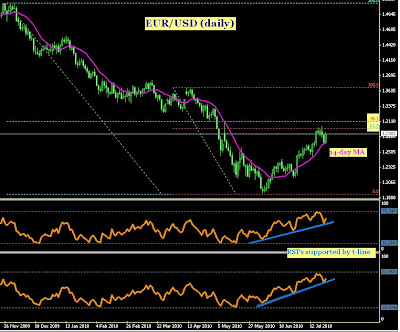
The bullish reversal in June initially begun with daily bullish divergence (a lower low in price-action compared to MACD's higher low). The subsequent recovery was led by a break in RSI trendline resistance and the key 14-day MA, confirming the short-term trend shift. Today's close above resistance at 1.2986 (the 61.8% retracement from the April high) suggests a move towards the key 1.3125 (38.2% retracement from the Q4 '09 high). An acceleration through this Fibonacci level, which also correlates with the DXY's (US Dollar Index) important 50% retracement at 81.43, would confirm an extended medium-term recovery. As such, US Dollar underperformance is likely to continue towards its 200-day MA and could materially boost the EUR/USD to the 1.35 region, near the 50% retracement from the Q4 '09 high. Note, however, that the MACD oscillator is diverging from current EUR/USD price-action and a loss of 14-day MA and RSI trendline supports would imply a growing risk that the short-term trend has exhausted.

Thursday, July 22, 2010

Divergences


Divergence is a common theme involved in my analysis. Generally, I focus on short-term divergences (hourly & 4-hourly charts) with price-action and the MACD oscillator. However, when divergences occur in the situations depicted above, all FX traders should take notice.
The first chart involves the Euro Index (the Euro vs a basket of currencies) and the EUR/USD. In June, the EUR/USD put in a lower low, but the Euro Index diverged and marked a higher low. This ultimately was a turning point that was also depicted in the second chart. Here, the EUR/USD net non-commercial position also diverged with price-action. In June, speculators lightened up on their short positions while the single currency headed lower. While these divergences occur only once in a while, they often hint of significant turning points.

07/22 - EUR/USD looks to retest key Fib


The EUR/USD has rebounded off the 14-day MA to solidify daily RSI trendline support (9 & 14-periods). While these remain in-tact, there is scope for a daily close above the key Fibonacci retracement at 1.2986 (61.8% of the April 12/June 7th decline) towards 1.3109 (38.2% retracement of the entire December 3rd/June 7th decline). Moreover, the interest rate differential between the EU and US has accelerated (in favor of the former) and the Euro remains net short by speculators, which should provide ample room for the single currency to appreciate. In the event that RSI trendline support is broken, focus would then shift to the rising 10-week MA (now in the 1.25 region).

Wednesday, July 14, 2010

07/14 - VIX rebounds off 200-day MA support


Since equity markets recovered from the most oversold condition since the March 2009 low, the VIX has relapsed it's way down to 200-day MA support. The latest rebound in the Volatility Index suggests that equity markets may continue to trade rangebound. Moreover, the DJIA (Dow Jones Industrial Average) has paused at a key Fibonacci retracement (78.6% of the June 21st/July 1st decline) and equity futures are demonstrating bearish MACD divergence on their 4-hourly charts. If, however, the VIX manages to substantially break down below the 200-day MA and the June low at 22.87, then its entirely possible that equity markets could extend back towards the 2010 highs set back in April. This would suggest further weakness in the US Dollar and could induce the EUR/USD to complete the Head & Shoulder's measured move above the 1.30 threshold. In the meantime, expect a large sideways move to continue for stocks.

Wednesday, July 7, 2010

07/07 - Gold's daily RSI base provides support


Gold broke out of a rising wedge pattern last week to pare back the largest yearly net long speculative position by large traders (according to the CFTC). The subsequent relapse has stalled at a familiar level, namely the 9-period RSI's 34 level. This oscillator base has supported price-action three out of the last four troughs over the last 8 months. 4-hour bullish MACD divergence has triggered a corrective bounce that looks to retest the 50-day MA (near Monday's high). A failure to reclaim the 50-day MA suggests a retest of the 1185 pivot, but again would represent a solid entry point for long-term bulls.

Thursday, July 1, 2010

07/01 - EUR/USD's inverse head & shoulders pattern


The EUR/USD has confirmed a complex inverse head & shoulders pattern with Thursday's clearance of neckline resistance. A weekly close above the 10-week MA at 1.2455 will invoke further strength towards 1.2670 (May 21st high) ahead of a move towards the inverse head & shoulder's target near the 1.30 handle. Meanwhile, the US Dollar Index rejected at a 10-day bear trendline, resulting in the loss of 50-day MA & platform (85.17 pivot) support. The DXY now seems poised to head lower towards it's 100-day MA. If, however, the 85.17 pivot is sustainably broken to the upside and the EUR/USD relapses back below the aforementioned neckline at 1.2360, then focus shifts back to the DXY's bear trendline and the EUR/USD's trendline support in the 1.2227 region.