Monday, September 13, 2010
Friday, September 10, 2010
09/10: CHART OF THE DAY

STRATEGY: LONG S&P 500 at 1056, risking 1070, targeting 1130
LONG USD/JPY at 83.72, risking 83.72 (revised), targeting 84.72


Thursday, September 9, 2010

Wednesday, September 8, 2010
S&P 500: Pauses at trendline resistance

Overly pessimistic bullish sentiment (according to the AAII survey) and oversold daily conditions have provided the catalyst for the S&P 500’s latest rebound, highlighting the completion of wave 2’s symmetrical zig-zag correction off the August highs. This sets up a possible powerful 3rd wave-rally that could extend towards the year-to-date high. While trendline resistance (originating from the August peak) has temporarily stalled the move, bullishly diverging hourly studies indicate support at a relatively high level.
In addition to bullish price-action, the S&P 500 is trading in a 15-day cycle with turning points every 15 calendar days or so. This suggests that the current rally should endure through the middle of next week barring some unforeseen event. As such, there is ample room for the market to extend the rebound, given daily studies are not quite overbought at the moment.
While the key 14-day moving average remains supportive (on a closing basis) and once trendline resistance is cleared, obvious resistance at 1130 is next targeted. A failure to retest this important pivot could put the entire recovery at risk and could alter the current Elliot wave count.
STRATEGY: LONG S&P 500 at 1056, risking 1070 (revised), targeting 1130 (revised)

Tuesday, September 7, 2010

Thursday, September 2, 2010
09/02: CHART OF THE DAY
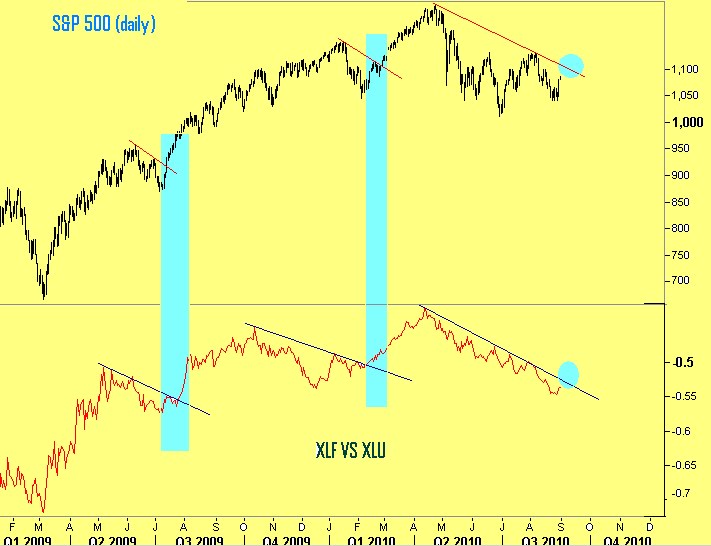
Since the April highs, the XLU (the Select Utility Sector Spider) has been the leading sector while the XLF (the Select Financial Sector Spider) has lagged. The relative strength comparison has ticked up as of late, but remains entrenched within a bearish downtrend. Consequently, a break of trendline resistance would confirm a resumption of the bullish campaign that originates from the March 2009 trough. This would trigger the S&P 500 to break key resistance near the 1100 region back towards the April highs.
STRATEGY: LONG S&P 500 at 1056, risking 1039, targeting 1100
Subscribe to:
Posts (Atom)