Translation Tool

Thursday, September 23, 2010

09/23: CHART OF THE DAY


The EUR/USD has pulled back from overbought conditions, highlighting a clear 5-wave structure off the September low. It is too early to determine whether a large zig-zag correction has been completed or if this is merely the termination of the first wave of a powerful 3rd wave extension. Either way, the anticipated correction is in play and while the EUR/USD consolidates above previous resistance at 1.3157, an extension to 1.35 is favored. This key level is not only the 50% retracement of the November to June decline, but its also a Fibonacci expansion of the June to August advance. If the current pullback exceeds the normal counter-trend length of 3-4 days, then Wednesday's high could represent an intermediate top and the base of the previous 4th wave at 1.3020 could be tested. Keep in mind that the first week of October marks the 4-month anniversary of the 2010 low and could represent significant resistance in time. Finally, since short-term technical studies are not oversold at the moment, I am looking for further weakness to buy into.
STRATEGY: BUY EUR/USD at 1.3181, risking 1.3126, targeting 1.3500

Wednesday, September 22, 2010

GOLD: Continues to ascend to fresh all-time highs


Gold continues to ascend to new heights. While the latest strength has accelerated and risks an exhaustive spike, the advance remains rather orderly. Since bottoming in July, the yellow metal has rallied in roughly 50 point increments then corrected 26 points before resuming the uptrend. Although, there is no clear wave structure, overbought daily RSI suggests a pullback at current levels. The measured correction would take Gold back to the 1270-1275 region before once again resuming strength. A swing low above the previous all-time high set in June would secure the chance of further upside towards the 1316-1320 area, where a cluster of Fibonacci extensions reside.

STRATEGY: BUY GOLD at 1275, risking 1258, targeting 1316

Tuesday, September 21, 2010

VIDEO OF THE DAY

http://www.youtube.com/watch?v=SjclxCa05Jk

I produced this video a little late and since then the S&P 500 has broken above 1131 (the fourth time was the charm!). I'll stick with my breakout target at 1150 to cap gains temporarily. The next important cycle is at month's end. Meanwhile, the DXY broke down further after the FOMC and is nearing the important 80 region. Look for this key pivot to temporarily support. I am looking for a pullback to BUY the S&P 500 and SELL the DXY. Also, I am looking for a deep retracement, possibly 61.8 to 78.6% of the intervention spike to BUY into the USD/JPY. I'll continue to update my trade recomendations once I see technical evidence emerge.

Monday, September 20, 2010

09/20: CHART OF THE DAY


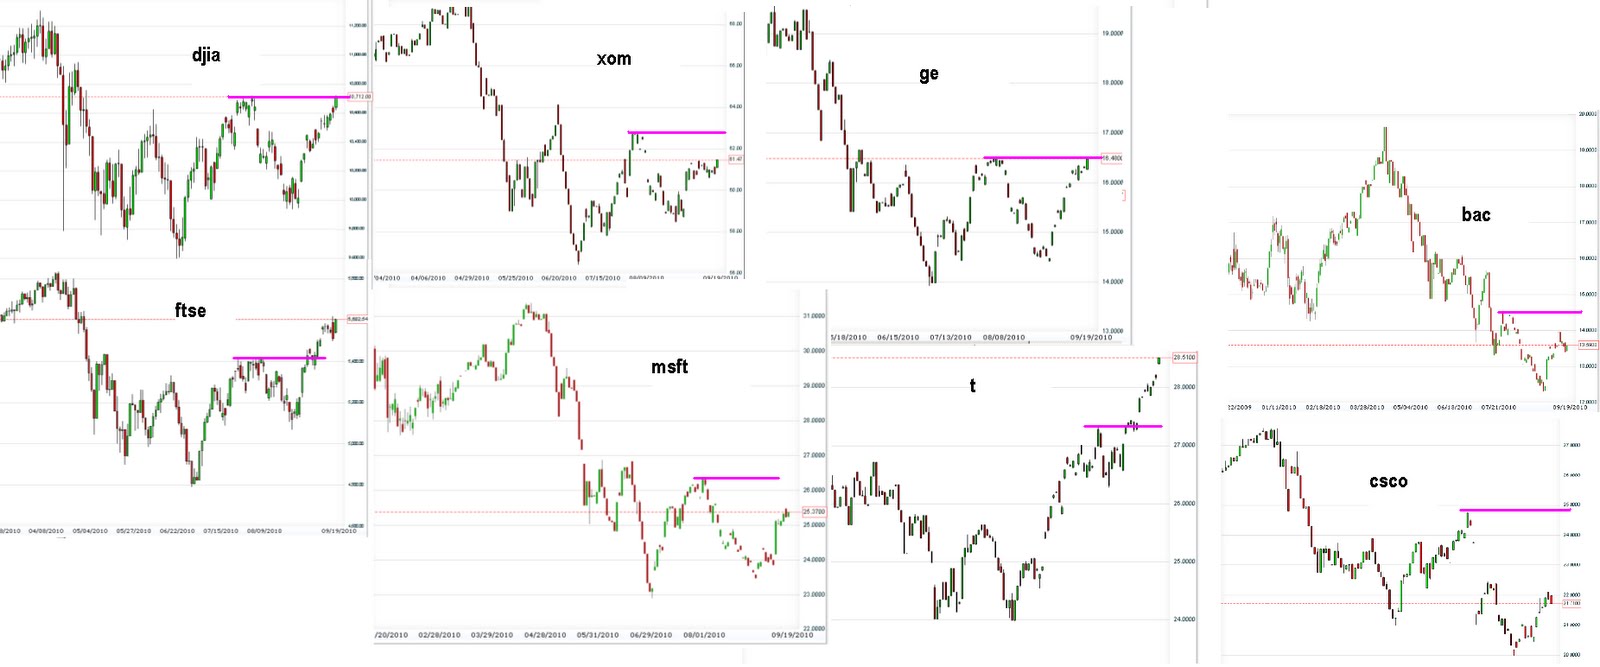
Indices extend to fresh 6-week highs, but some key individual names continue to lag. I am watching the small-caps (SML) at the the key 360 level to judge whether the recovery can last.

Thursday, September 16, 2010

Wednesday, September 15, 2010

US Dollar Index: Confirms Head & Shoulders Pattern


The US Dollar Index has broken below the neckline of a short-term Head & Shoulders pattern. As such, weakness is now anticipated to retest support that held the April & August lows, near the formation’s measured move target. Moreover, the 200-day MA has become resistance, which highlights the inability to reclaim former neckline support. This suggests that weakness could quickly resolve into a bearish thrust to 79.81/80.07 (61.8% retracement/ August low) then briefly recover ahead of a potential final exhaustive decline that would then complete the bear campaign. Meanwhile, reclaiming former neckline support at 81.90 will stabilize and potentially reopen short-term trendline resistance located near 82.70.

STRATEGY: LONG S&P 500 at 1056, risking 1103, targeting 1130
BUY EUR/USD at 1.2938, risking 1.2883, targeting 1.3382

Tuesday, September 14, 2010

09/14: CHART OF THE DAY


STRATEGY: LONG S&P at 1056, (revised) stop at 1103, targeting 1130