Translation Tool

Tuesday, November 30, 2010

Daily DXY Roundup - 11/30


The US Dollar Index (DXY) has officially reached overbought conditions according to the daily Relative Strength Indicator (RSI). The 80 threshold was cleared for only the second time this year. While there is a lack of daily bearish divergence, the greenback may be vulnerable for a pullback. An hourly rising wedge formation and bearish hourly diverging studies also hint of a period of consolidation before reaching the targeted 82 region.


The EUR/USD broke below the key 50% retracement at 1.3075 to shift focus towards an equality target at 1.2940. Bullish diverging hourly studies hint of a possible retest of 1.3075 before eventually targeting the 61.8% retracement level near the 1.28 handle. Meanwhile, this pair remains structurally bearish while price-action remains capped by last week's low at 1.32.

Monday, November 29, 2010

Daily DXY Roundup: 11/29


Continued risk aversion has benefited the greenback, triggering a 2-month high for the DXY (US Dollar Index). The October/November double bottom measured move has been exceeded to suggest a possible extension to the 82 region. This key level coincides with the 200-day moving average, the 78.6% retracement and an equality target. Meanwhile, only a move below 79.461 (the November 16th swing high) would alter the short-term bullish wave count.

The EUR/USD is at a key inflection point. A sustained loss of the key 50% retracement level at 1.3075 would shift the medium-term outlook much lower. While former trendline support near the 1.33 handle continues to cap, a move towards the equality target at 1.2940 is favored.

The Cable's (GBP/USD) intra-day bearish rejection at 1.5652 (the October low) has maintained the immediate bearish structure. The 200-day moving average is next targeted while price-action remains capped by the key 1.5652 pivot.

11/29: CHART OF THE DAY


Friday, November 26, 2010

Daily DXY Roundup: 11/26


The US Dollar Index (DXY) cleared the psychological 80 level on the third attempt in as many days. The key 61.8% retracement was reached before consolidation took hold. The 200-day moving average is now targeted while price-action remains supported by last week's swing high of 79.461. Meanwhile, the Powershares Bullish US Dollar Index ETF (UUP) has cleared 23 resistance to bring the 24 level into focus.

The EUR/USD failed to reclaim the 1.3446 former support region, leading to a probe below 5-month trendline support. While the 20-day moving average continues to cap, a move is favored towards the 50% retracement and 200-day moving average just below the 1.31 handle.

11/26: CHART OF THE DAY


Tuesday, November 23, 2010

STRATEGY UPDATE:

While the UUP has probed above key resistance, a marginal break has left room for a false-break reversal. The dollar is overbought at the moment and is exhibiting negative divergence with daily studies. Thus, at this point the UUP may need to consolidate gains before attempting to clear the important 23 level. Also, some of the majors have paused at key levels to suggest a possible short-covering reversal. The EUR/USD has stalled losses near the 100-day moving average and the key 38.2% retracement. The AUD/USD has found platform support near the .97 handle. As such, I am looking to establish a long position at current levels.

STRATEGY: BUY AUD/USD at .9780, risking .9725, targeting .9825 1st

Daily DXY Roundup: 11/23


The US Dollar Index (DXY) exploded higher Tuesday amid tensions in Korea and ongoing European sovereign debt concerns. The latest strength has now erased more than half the losses from the August highs. More importantly, the Powershares US Dollar Index ETF (UUP) has crossed above key resistance. Further dollar strength is favored towards the UUP's 24 region, while price-action remains near or above the important 23 handle.
The EUR/USD collapsed on the back of heightened risk aversion, confirming a secondary top or lower high. The pair has retraced 38.2% of gains off the June trough. Further weakness targets a Fibonacci extension level at 1.3265, while the 1.3440 region caps.
The GBP/USD broke below key 50-day moving average support to shift focus lower. The 1.5730 pivot is immediately targeted ahead of the 1.5660 region, while price-action remains below the 1.5837 swing low.

Monday, November 22, 2010

Daily DXY Roundup: 11/22


The US Dollar Index (DXY) initially retreated before finding support at a key 38.2% retracement near the 78 handle. Irish budget concerns fueled risk aversion, allowing the dollar to recover overnight losses. Bullish diverging hourly studies triggered a rebound that tested 78.88, near the 61.8% retracement of the November 16th/22nd dip. While the 50-day moving average continues to support on a closing basis, a move towards the key 50% retracement level at 79.587 is favored.
The Powershares US Dollar Index ETF (UUP) has inched closer to key resistance at 23. If this level is cleared, history suggests that the dollar should appreciate significantly. Follow-through strength would target the 24 region.
The EUR/USD briefly probed a key Fibonacci retracement at 1.3760 before Irish headlines hit the tape. The pair quickly gave back over half of last week's short-term double bottom recovery.
Price-action eventually found a foothold above 1.3570, maintaining the possibility of forming an inverse head & shoulders base. Meanwhile, losing 1.3570 could expose the 1.3440 pivot, which coincides with the 50% retracement of the move up from August.
The GBP/USD once again rejected near the 50% retracement at 1.6068. Subsequent weakness confirmed a secondary top or lower high. As such, losing 50-day moving average support could shift focus to the 1.5730 region.

Saturday, November 20, 2010

Dollar Direction Dependent on UUP


On Monday, the Powershares US Dollar Index ETF (UUP) celebrates its 4-year anniversary. Despite its short existence, the UUP has provided a clear-cut way to play the greenback. In both cases when the UUP clears the 23 level, the US Dollar Index tends to breakout to the upside.

Following the Bear Sterns collapse, the UUP was in the process of forming a base at the 22 level. In the ensuing months, price-action held within a tight range between 22 and 23 up until the Lehman bankruptcy. As a result of the panic selling in September 2008, the UUP managed to clear the key 23 level. This triggered a dramatic recovery that climaxed at all-time highs.

Just over a year later, the UUP was back down to the 22 handle. Once again this key level provided support. However, this time it was risk aversion inspired by the fallout of Dubai's debt problems that allowed the US Dollar to carve out a bottom. After briefly respecting the 23 level as resistance, the subsequent clearance led to a powerful 10% rebound.

The US Dollar Index eventually reached a peak back in June. This coincided with the finalization of a comprehensive rescue package that ensured financial stability across Europe. The introduction of additional quantitative easing by the Federal Reserve provided a further drag on the dollar, triggering the latest test of the 22 region.

Recent euro weakness, stemming from Irish sovereign debt concerns has allowed the UUP to recover from the 22 region. This has enabled the dollar to bump up against key resistance. While Tuesday's rejection at 23 maintains the ongoing bearish structure, history suggests that while 22 remains supportive, the UUP should be accumulated.

If the 23 level is sustainably broken, then the US Dollar should appreciate significantly. In the previous two occasions, initial strength reached the 24 level before eventually targeting the 26/27 area. If 23 continues to cap, however, then the dollar's recovery could be in jeopardy. A move below 22 support would translate into uncharted territory for the UUP.

Friday, November 19, 2010

Daily DXY Roundup: 11/19


The US Dollar Index (DXY) continues to respect the 50-day moving average on a closing basis. Bullish diverging hourly studies triggered a rebound off the European lows that eventually rejected at 50-hour moving average resistance. This potentially jeopardizes the near-term bullish structure and could signal a test of the 38.2% retracement level at the 78 handle. Meanwhile, clearing the key 50-hour moving average would increase the probability of confirming a higher low. .

The USD/CHF has garnered attention with the latest back-to-back bearish rejections at the psychological parity threshold. This pair is now favored to test the 100-day moving average while price-action remains above .9900 on a (daily) closing basis.

The EUR/USD’s recovery fell short of the key Fibonacci retracement at 1.3760, capping gains at the 200-hour moving average. The short-term double bottom recovery remains relatively firm, given its distance above the 100-hour moving average. Clearing 200-hour moving average resistance should trigger a test of the targeted 1.3760 level.

The GBP/USD rejected near the 50% retracement at 1.6068 on the back of bearish diverging hourly studies. The subsequent retreat managed to maintain support just above the 61.8% retracement near the end of European trade. A decisive loss of this Fibonacci level could put 50-day moving average support in jeopardy.

The AUD/USD has formed an inverse Head & Shoulders base with the latest dip. A clean upside break of neckline resistance in the .9900 region would be an attractive (long entry point).


11/19: CHART OF THE DAY


Thursday, November 18, 2010

Daily DXY Roundup: 11/18


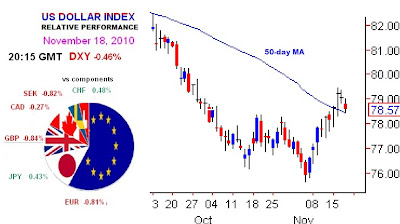
The US Dollar Index (DXY) continues to consolidate within Tuesday’s wide-ranging day. The overnight loss of 50-hour moving average support triggered a retest of the 50-day moving average. The current retreat, however, is still in corrective territory, given only a quarter of recent gains have been reversed. While dollar bulls seek higher low confirmation for a test of 79.587 (50% retracement), a daily close below 50-day moving average support would shift focus to the 78 handle.

The EUR/USD extended Wednesday’s double bottom recovery before stalling at the 50-day moving average. Only a loss of the formerly resistant 100-hour moving average would shift focus away from 1.3760 (Fibonacci retracement).

The USD/JPY remains well-bid ahead of the 50-day moving average. While price-action stalled at 83.76 (the 61.8% retracement) continued strength towards the upper 84 region is favored.

The GBP/USD continues to respect 50-day moving average support. The latest rebound has recovered more than 38.2% of the recent weakness, suggesting further strength through 1.6068 (the 50% retracement).

The S&P 500 rebounded from the correction target of 1175/1180 on the back of oversold daily conditions. Reclaiming the 14-day moving average at 1203 is now required to shift the near-term focus higher.

11/18: CHART OF THE DAY


Wednesday, November 17, 2010

Daily DXY Roundup: 11/17


The US Dollar Index (DXY) consolidated recent gains in an otherwise non-eventful day. Overbought daily conditions along with bearish diverging hourly studies triggered a slight pullback that has marked a daily harami (inside day). While this suggests that dollar bulls have taken a breather, only a sustained loss of 50-hour moving average support would indicate that a deeper correction is in store. This would likely imply a retest of the double bottom neckline and the key 50-day moving average above the 78 region. Meanwhile, the next upside hurdle comes in the form of the 50% retracement at 79.587.

The EUR/USD found support near the 50% retracement zone off the August lows. Oversold conditions and bullish diverging hourly studies triggered a small 2-day double bottom base. This hints of a possible re-test of the 100-hour moving average, which has capped rallies over the past few days. Further strength would then target the mid 1.36 region, where several key retracement levels overlap. Meanwhile, the short-term structure is quite bearish while price-action remains capped below Friday’s swing low at 1.3575.

The USD/JPY backed off a bit, breaking (down) out of a 2-day consolidation triangle pattern in early North American trade. This has potentially left a daily tweezer top formation to hint of a near-term pullback or further consolidation. Meanwhile, while price-action remains above the previously resistant 50-day moving average, the outlook is for an upward move to the upper 84 region.

The S&P 500 has already met my correction target zone at 1175/1180 region. The current 4th wave correction is now a Fibonacci (61.8%) proportion of the previous 2nd wave correction. While oversold daily conditions could limit further weakness, reclaiming the 14-day moving average at 1200 is now required to shift the near-term focus higher.

GOLD finally lost 30-day moving average support to neutralize the medium-term outlook. Longer-term bulls should take notice of the daily (9-period) RSI. This key oscillator is now nearing oversold conditions near the 30 region, which is a level that has supported previous rebounds over the last year. Meanwhile, if the 50-day moving average fails to provide support, then focus shifts to the Fibonacci retracement at 1324

11/17: CHART OF THE DAY


Sunday, November 14, 2010

Friday, November 12, 2010

Daily DXY Roundup: 11/12


The US Dollar Index (DXY) reached a fresh 5-week high before pulling back in the North American session. Heightened risk-aversion enabled the greenback to test the 50-day moving average for the first time in more than 2 months. Weekly studies have shifted higher and the weekly close has marked a bullish engulfment. A confirmed double bottom hints of further near-term gains, given daily MACD has broken above the midpoint threshold. The next hurdle for dollar bulls is the 38.2% Fibonacci retracement level at 78.650. While there is a high probability of forming another higher low within the next few days, a pullback to the 20-day moving average cannot be ruled out.

The EUR/USD found support at the 50-day moving average, likely completing the first leg of an A-B-C correction. A daily close below the 1.3622 region (Fibonacci retracement) will shift focus onto the 1.34 handle, where the corresponding 50% retracement lies. Meanwhile, the Euro Index (EXY) has given up nearly half of its gains from June’s yearly low.

The USD/JPY recovered from weakness in the overnight session to retest the key 50-day moving average once again. Above this resistance would mark the first back-to-back series of higher lows since late July. If confirmed, the critical 83 handle will be exposed. Meanwhile, another test of the 20-day moving average could materialize next week due to increased risk aversion.

The S&P 500 has finally closed below 14-day moving average support. This confirms the termination of the latest powerful 3rd wave, opening up the possibility of a complex 4th wave correction. The 1175/1180 region is where I anticipate this correction will likely end up. This would be roughly 61.8% the size of the 2nd wave, which is what supported the euro in its 4th wave correction last month.

11/12: CHART OF THE DAY


Thursday, November 11, 2010

Wednesday, November 10, 2010

Daily DXY Roundup: 11/10


The DXY’s (US Dollar Index) recovery completed the initial correction target before reversing course. The late October highs were tested before bearish diverging hourly studies took hold. This triggered a reversal that wiped out most of the day’s gains, leaving a daily doji hammer formation. However, since it took only 4 days to match the previous 6-day decline, there is a high probability of forming a higher low within the next few days. While previous 20-day moving average resistance is the most likely candidate of support, a deeper retracement cannot be ruled out. In the process of completing a bear campaign of this magnitude, it is not uncommon to retrace a major portion of the corrective recovery. Thus, key proportions to watch are the 25%, 38.2%, 50%, 61.8% & 78.6% retracements of the latest 4-day range.

The USD/JPY rebounded to test the 50-day moving average. A higher low on top of previous range resistance near the 82 handle would be an encouraging development for dollar bulls. Meanwhile, a daily close below the formerly resistant 20-day moving average would be bearish.

Treasury market developments took center stage in late afternoon trade, as the 30-year bond auction fuelled a short-covering rally along the entire curve. This in turn dragged down yield differentials which added steam to the US Dollar's bearish reversal. While price-action for US yields was decisively bearish today, further consolidation is favored in the medium-term.

11/10: CHART OF THE DAY


Tuesday, November 9, 2010

Daily DXY Roundup: 11/09


The US Dollar Index (DXY) recovered from selling pressure earlier in the day to close above the 20-day moving average for the first time in nearly two weeks. Since completing impulsive weakness last week, dollar bulls look poised to retest the late October highs above the 78 handle. Additional strength would expose the 50-day moving average, given bullish diverging daily studies.

The Japanese Yen was the weakest component of the day. The USD/JPY broke-out in late trade once the 20-day moving average was cleared. This marks the first daily close above key resistance in more than 6 weeks. As such, continued strength towards the 50-day moving average is now favored.

The most interesting price-action was not in the fx market, but rather in the metals complex. Both Gold and Silver reached fresh cycle highs before pulling back quite substantially. Gold marked a key reversal day and Silver put in a daily spinning top. Follow-through weakness would trigger further support for the DXY.


11/09: CHART OF THE DAY


Monday, November 8, 2010

Daily DXY Roundup: 11/08


The US Dollar Index (DXY) continued its counter-trend recovery, extending Friday’s bullish engulfment pattern. Reclaiming 76.709 (October 25th swing low) hints of the completion of impulsive weakness originating from the June high. There is still a strong chance of developing a 5-wave ending diagonal, given the position of the (Elliot) wave count. Either way, a typical correction target projects a move to the vicinity of the previous wave’s peak, which in this case lies above the 78 handle. Bullish diverging daily studies also suggest further strength for the greenback. Meanwhile, Monday’s inability to clear the 20-day moving average is somewhat of a concern for dollar bulls. A rejection at this key resistance could trigger a temporary setback. Trading back below the 76 region would increase the probability of resuming weakness towards the 2009 low.

While the Swedish Kroner was the weakest performing component, widening credit default spreads have triggered headline risk for the EUR/USD. The second day of counter-trend price action suggests a possible move to 1.37, given bearish diverging daily studies.

The USD/JPY continues to flirt with the 20-day moving average. Only a daily close above this key resistance will suggest further strength towards the important 50-day moving average. Meanwhile, a bearish rejection could spell another shot at the psychological JPY80 level.

Sunday, November 7, 2010

Spanish Fun Run Exposes Euro's Challenges

Friday's rumor of a run on a Spanish bank proved to be false, but may have shed light on Europe's ongoing challenges.

Banco Bilbao Vizcaya Argentaria (BBVA) sponsored a fun run that drew a large crowd on Friday morning. The banks queues falsely spurred insolvency rumors that sent ripples throughout the financial world.

While the rumors were squashed hours later the damage was already done. The euro tumbled nearly 1% against the dollar as the scrutinized 2-year EU/US yield differential narrowed to a 2-week low.

More importantly, however, for the first time in sometime event risk was driven by news from outside the United States. The currency markets have been obsessed with the anticipation of the Federal Reserve's QE II. According to Ashraf Laidi of CMC Markets, the EUR/USD has risen 3.5% in a 2 week span while Irish/Greek/Spanish 10-year spreads widened 20-25% relative to German yields.

With memories still fresh of the European sovereign debt crisis, widening periphery spreads are causing many to refocus on the Eurozone's challenges. The Irish spread widened to a record high against the benchmark German Bund on Friday. This highlights Ireland's debt problem due to mounting cost of bailing out the problematic banking system.

Elections in Greece have highlighted anxieties of austerity measures, causing the Greek/German to widen to their highest levels since September. And in Spain, spreads have widened to 4-month highs as government's budget cuts continue to face widespread opposition.

Friday's positive non-farm payroll report may suggest that the US economy is not as bad as Ben Bernanke and company have expected. With QE II now fully discounted there is a high probability that market focus could shift back to Europe's stressed sovereign political outlook.

While it may be premature to call a bottom in the US Dollar, there is technical evidence that Friday's corrective recovery could continue into the middle of next week. Bullish diverging daily studies could direct dollar bulls towards the resistant 20-day moving average.

Friday, November 5, 2010

Daily DXY Roundup: 11/05


The US Dollar Index (DXY) rebounded off Thursday’s fresh yearly low, marking a daily bullish engulfment pattern. Reclaiming wave III’s swing low of 76.144 hints of trend exhaustion and has soften the bearish wave count. While it may be premature to call the termination of impulsive weakness, the corrective recovery may extend through the middle of next week. Bullish diverging daily studies could direct dollar bulls back towards 20-day MA resistance near the 77 handle. Meanwhile, the probability of resuming weakness towards the 2009 low remains high while price-action is capped by the 38.2% retracement of the October 27th/November 4th relapse.

11/05: CHART OF THE DAY


Thursday, November 4, 2010

Daily DXY Roundup: 11/04


The US Dollar Index (DXY) has reached a fresh yearly low as a result of Wednesday’s FOMC meeting. This week’s consolidation triangle breakdown has fueled dollar bears through key long-term trendline support. Once a trendline of this magnitude is broken, typically it is retested before resuming in the direction of the trend. A retest of the 76.100 region level cannot be ruled out, given possible diverging daily studies. Meanwhile, a capitulation-type move towards the 2009 low is possible while price-action remains capped by the October 15th swing low at 76.144.

The euro continues to be one of the main beneficiaries of dollar weakness. The Euro Index (EXY) has touched 112, reaching fresh 6-month highs. The EUR/USD is now firmly within the fifth wave of impulsive strength off the June lows. While bearish daily divergence hints of a pullback, the short-term uptrend remains intact while price-action remains above last week’s high at 1.4080.

The USD/JPY failed to clear the 20-day MA once again, but remains relatively steady above the psychological 80 level. If dollar weakness persists, this key level should be challenged. In the event of a marginal test, however, a false-break rebound similar to this week’s move is entirely possible. Meanwhile, the bearish campaign will remain intact until the 20-day MA is cleared.

The GBP/USD continues to extend gains and now seems destined to retest the 1.64 handle. This coincides with the 2010 high and a confluence of Fibonacci levels. While the sterling’s wave count is not as bullish as the euro, the uptrend is firmly intact while price-action remains above 1.61.

11/04: CHART OF THE DAY


Wednesday, November 3, 2010

Daily DXY Roundup: 11/03


The DXY’s (US Dollar Index) rally faded after the FOMC (Federal Open Market Committee). Closing price-action confirmed follow-through from Tuesday’s bearish engulfment pattern. The latest consolidation break-down has now directed dollar bears towards key trendline support near the 76 handle. A decisive close above the 20-day MA at 77.20 is required to stabilize the current bout of selling pressure.

The Yen was the clear loser of the day, prompting intervention rumors by the MOF (Ministry of Finance). The USD/JPY accelerated through stops after confirming a higher low above Tuesday’s high. Clearing the 20-day MA is the next obstacle and doing so would expose the key JPY82 region. Only above this key pivot suggests a more meaningful rally is in store.

The EUR/USD continues to extend gains since breaking out of a triangular consolidation pattern. From an Elliot wave perspective, the completion of the corrective fourth wave has now triggered the terminal fifth wave. While EUR1.4186 is a significant technical level, it is too early to determine whether the fifth wave extension will be a mere throw-over.

In the meantime, the currency markets will have to keep an eye on the S&P 500. The index is nearing a confluence of Fibonacci levels in the 1202/1203 region. A rejection at this pivot could set the stage for the DXY to complete impulsive weakness.

11/03: CHART OF THE DAY


Both the US Dollar Index (DXY) and EUR/USD have broken-out of their respective triangle patterns. This suggests further dollar weakness towards key long-term trendline support near the DXY76 handle. This should correlate with a test of EUR1.4186, which also carries technical significance. Meanwhile, the S&P 500's uptrend remains intact until 14-day MA support is broken. Due to the tight inverse correlation, dollar weakness could trigger the S&P to test the key 1202/1203 level.

Tuesday, November 2, 2010

Monday, November 1, 2010

11/01: CHART OF THE DAY


Subwave e now underway since hourly divergence halted subwave d earlier. The estimated range to complete the 5-wave triangular pattern lies in the 1.3780/1.3830 range. The borders of this symmetrical formation now serve as clear breakout barriers. Meanwhile, the USD/JPY remains dangerously close to the psychological 80 level.

STRATEGY: LONG EUR/USD from 1.3780 MET TARGET (1.3962/1.4023)