Translation Tool

Friday, October 29, 2010

10/29: CHART OF THE DAY


The DXY's (US Dollar Index) subwave d has stalled just above Thursday's low at 77.167. This may suggest that the current subwave has not terminated and has more to go before entering the final stages of the latest complex correction. While the EUR/USD is in a similar position, the USD/JPY should be carefully watched as it continues to hover near 15-year lows. Typically in bear markets of this magnitude, markets tend to accelerate once key lows are breached. Thus, a marginal test of JPY80.41 could result in a false-break rebound, given the move down from 82.00 has been weak (from a time standpoint). Once again, it depends on whether the MOF decides to intervene and defend the psychological JPY80 threshold. Meanwhile, the S&P 500 continues to test 14-day MA support. If this key support is lost on a closing basis, then the DXY has a chance to recover back towards the 78 handle.

STRATEGY: LONG EUR/USD from 1.3780, trailed stop-loss at 1.3780, targeting 1.3962/1.4023

Thursday, October 28, 2010

10/28: CHART OF THE DAY


Bullish hourly diverging studies helped complete subwave c within the corrective wave IV. Subwave d is now underway and could extend to 1.3970/1.4030 before starting the terminating subwave.

STRATEGY: LONG EUR/USD 1/2 took profit (55 pips), 1/2 targeting 1.4023, stop-loss trailed to cost (1.3780).

Wednesday, October 27, 2010

10/27: CHART OF THE DAY


Watch the S&P 500 closing price. A close below the key 14-day MA at 1176 could potentially signal a medium-term trend shift. In the above chart, I have highlighted the size and proportions of the previous wave II correction made in August . The 61.8% proportion above 1140 should be watched, especially since the EUR/USD initially paused at this level last week (the euro tends to be a leading indicator). Alternation signals the formation of a complex correction that could get choppy in the next few days depending on the extent of the dollar's corrective strength. A normal correction would target the 1136/1157 region, where bulls are likely to reemerge.

STRATEGY UPDATE: LONG EUR/USD position took 1/2 off for 55 pip profit, stop-loss remains at 1.3725 for remainder of the position.

Tuesday, October 26, 2010

EUR/USD and Euro Index Diverge Once Again


Price-action in FX markets continues to be largely driven by positioning rather than fundamental factors.

The latest CFTC IMM report highlighted a 10% reversal of the largest net short position seen since late 2007. This has occurred while 2-year yield differentials between the Eurozone and US continue to widen to fresh yearly highs.

Speculators have lightened up on short dollar positions primarily due to the event risk spurred by last weekend's G-20 meeting and technical factors. The perception that QE II may have been fully discounted by markets may have played a role as well.

In the Eurozone, meanwhile, expectations of a possible Q1 ECB rate hike have boosted the trade-weighted Euro Index to fresh 5-month highs. This has created a divergence of sorts, as the EUR/USD failed to reclaim recent highs above 1.41.

The last time this type of divergence occurred was in July. Back then, the Euro Index had just reached a fresh yearly low while the EUR/USD carved out an eventual higher low. The divergence between the two metrics correctly hinted of a short-term (bullish) reversal for the single currency.
While this may portend further EUR/USD weakness, Elliot wave analysis suggests that this is merely a correction within the broader uptrend. The most likely outcome is an eventual upside breakout once the ongoing triangular consolidation terminates.
STRATEGY: BUY EUR/USD at 1.3780, risking 1.3725, targeting 1.4023

Monday, October 25, 2010

10/25: CHART OF THE DAY

EUR/USD has stalled at the 78.6% retracement of the October 15th/19th correction. This suggests the completion of wave b within the ongoing wave 4 correction. Wave c is anticipated to test the 1.3773/1.3824 region before giving way to the formation of wave d. Watch for bullish hourly diverging studies to hint of the completion of wave c. Meanwhile, the DXY (US Dollar Index) remains shielded from key long-term trendline support near the 76 handle while trading above shoulder support of a possible inverse head & shoulders pattern.


Friday, October 22, 2010

10/22: CHART OF THE DAY


Since the completion of wave III, the EUR/USD has corrected within wave IV. Since wave II was a simple correction, a 5-wave triangle pattern is favored to form. Bullish hourly diverging studies completed wave a on Wednesday. This produced the latest wave b rally, which may or may not have been completed on Thursday. Depending on Monday's price-action, wave c is anticipated to extend corrective weakness to EUR1.3650. Wave d could potentially arrive towards the end of next week to possibly set-up the terminating wave e. This could potentially take the EUR/USD to the key 1.3560 level in which I have highlighted over the last few posts. If, however, the current rebound reclaims the 1.4155 high, then the complex triangle scenario is compromised.

Thursday, October 21, 2010

10/21: CHART OF THE DAY


The Eurozone-US 2 year differential reached a fresh 2010 high on Thursday. This suggests further strength for the euro once the current correction runs it course. Any dips that near the key Fibonacci retracement at 1.3560 should be accumulated for an extension towards 1.4186.

Wednesday, October 20, 2010

10/20: CHART OF THE DAY


The S&P 500 continues to extend impulsive 3rd wave strength while the key 14-day MA remains supportive on a closing basis. There is a cluster of Fibonacci measurements that signal significant resistance near the 1200 level. This pivot is likely to terminate the current 3rd wave (if it gets there in the short-term) given bearish diverging daily studies. The eventual 4th wave is likely to be of the complex variety, possibly a triangle formation. The 5th wave should test the 2010 highs, possibly reaching another Fibonacci cluster in the 1230 region. Meanwhile, only a loss of the 1129 region (first wave's peak) alters the wave count.

STRATEGY: SELL at 1201, risking 1231, targeting 1169

Tuesday, October 19, 2010

Dollar Forms Key Reversal Pattern


The dollar's recent correction was long overdue, and there are signs it could continue into next week.

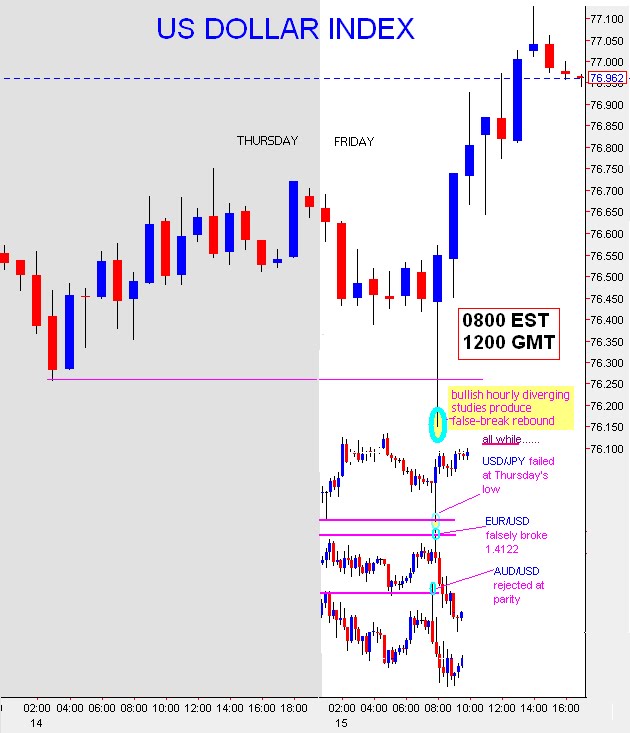
The greenback has suffered mightily due to expectations about a second round of quantitative easing, or QE2, from the Federal Reserve. The dollar briefly touched on new 2010 lows after the release of Fed Chairman Ben Bernanke's speech on Friday, but the ensuing false-break recovery suggests that the currency market may have priced in QE2 fully, something the bond market also appears to have done.

Although the dollar's correction was overdue, speculators continue to ignore the fundamentals. In fact, dollar bears began the week accumulating fresh short positions on the back of renewed risk appetite.

Not only was Monday's dollar selloff short-lived, but China's decision to raise interest rates caught many traders off guard. Although the dollar index's (DXY) recovery technically is still considered corrective (so long as the index remains below the 79 handle), there is sufficient evidence that the correction can continue.

The dollar's rebound has already retraced a quarter of its losses since late August. Although this is considered a typical correction within a bear market move, the follow-through move early in Tuesday's North American session has confirmed the formation of a secondary swing pivot within the euro/dollar (EUR/USD), Australian dollar/dollar (AUD/USD), dollar/yen (USD/JPY) and gold.

A secondary swing pivot is characterized as a lower high within an uptrend or a higher low within a downtrend. Most turning points require the formation of a secondary swing to complete or consolidate the trend. Although it often takes a series of swing pivots to confirm a trend reversal, the latest price action is a promising sign for dollar bulls.

According to Elliot Wave analysis, the DXY has completed the third wave and has now entered the corrective fourth wave. The second wave was a simple three-wave correction. Thus, due to alternation, there is a high probability that the current correction could be complex. Meanwhile, the wave count will be altered only if the index moves higher than the 80 threshold. That would indicate a more meaningful rally would be in store.

Due to the lack of countermoves or corrective price action within the recent move, it's extremely important to watch key retracement levels. Oversold dips that exhibit bullish hourly divergence near the 38.2% retracement at 1.3560 in the EUR/USD will likely offer support

STRATEGY: BUY EUR/USD at 1.3560, risking 1.3505, targeting 1.4186

10/19: CHART OF THE DAY


Yesterday, I highlighted the risk of forming a secondary or lower high for the EUR/USD, AUD/USD and Gold. Each metric stalled at a noteable retracement level in the Asian session. Once again, diverging hourly studies hinted of an impending reversal that was confirmed early in the North American session. As a result, I have exited my long Gold position and initiated a long USD/JPY position. The dollar/yen is finally showing signs of a base with today's confirmation of a short-term double bottom.
STRATEGY: LONG USD/JPY at 81.45, risking 81.05, targeting 82.11 1st

Monday, October 18, 2010

10/18: CHART OF THE DAY


The DXY's false-break rebound that began on Friday stalled earlier in the North American session due to a few technical developments. The EUR/USD, AUD/USD and Gold all stalled near key moving averages while hourly studies began to bullishly diverge. This has led to a 50% reversal so far. While there is risk of forming secondary highs if price-action stalls here or near key Fibonacci levels (61.8%/78.6%), the uptrends remain firmly intact.
STRATEGY: LONG GOLD at 1364.60, risking 1348.40, targeting 1436.50

Saturday, October 16, 2010

Friday, October 15, 2010

10/15: CHART OF THE DAY


The Aussie has formed a small double top and highlights a bearish rejection at the psychological 1.0000 level. The formation of a rising wedge accompanied by diverging hourly studies hinted at a possible reversal before the "risk on" trade rolled over in the North American session. Averaging the 3 largest corrections within the latest leg up projects a pullback to the .9762 swing low. As such, I am looking just above that region to reinitiate a AUD/USD long position.

STRATEGY: BUY at .9782, risking .9727, targeting 1.0022

Thursday, October 14, 2010

10/14: CHART OF THE DAY


In this quarterly chart, the EUR/USD's previous midpoint has consistently influenced price-action. The 50% retracement of the 2008 range is 1.4186 and should play a role in the last quarter of 2010.

Key technical developments to keep an eye on are the USD/JPY's 4-hour bullish hammer formed earlier today and whether the Dow Jones Industrial Average and S&P 500 will close below yesterday's opening levels and mark daily bearish engulfment patterns. In the meantime, I'm focused on buying GOLD at the 1364 region, where a former swing high intersects a 38.2% retracement level.

Wednesday, October 13, 2010

Bond Market Bubble?

The FOMC minutes published on Tuesday continued to remind investors of the Federal Reserve’s commitment to ultra-low interest rates. Since then, however, the long-end of the curve has sold-off quite dramatically. The 10-year yield is up nearly 10 basis points and the 30-year is nearly 20 basis points off recent lows. This is partly due to the recent surge in risk appetite as equity markets worldwide continue to ascend to multi-month highs. But more importantly, the temporary correction in bond yields could suggest that the Fed’s so called “QE 2” may be fully priced in.

In a recent survey by Reuters earlier in the month, 14 out of 15 primary dealers anticipated additional quantitative easing at the next FOMC. As such, the market has had ample time to price in the Fed action’s, which by most estimates is seen between $500 billion to $1.5 trillion.

While the Fed would prefer to have higher inflation expectations, there is some evidence that the recent rise in commodity prices and precious metals are beginning to feed through. Just today, the break-even rate for 5 and 10-year Treasuries (the difference between cash yields and inflation-linked bonds) reached their highest levels since June.

According to a JP Morgan survey, this is occurring while bond optimism amongst investors is at yearly high. Extreme levels of sentiment are often viewed as a contrarian indicator and could also suggest why bond prices could be in store for a period of consolidation.

Globalization has synchronized worldwide asset price movement like never seen before and bond markets are no exception. The Eurozone’s 2-year yield is up 20 basis points over the past month and Euribor rates have reached fresh yearly highs as the ECB now seems committed to an exit strategy from easy monetary policy.

If Treasury yields continue to lag behind, then yield differentials will continue to widen out against the U.S. This will inevitably further damage the Greenback and cause asset prices to continue to reflate. At some point, however, the treasury markets will have to respond by pricing in the inflationary affects of the Fed’s actions and cause the bond market bubble to burst.

10/13: CHART OF THE DAY


The EUR/USD and the 2-year yield spread between the EU and US have traded in lock-step. The 2-year spread, which has continued to widen in the EU's favor has cleared a 61.8% retracement while the EUR/USD continues to hover around it's key Fibonacci level. Due to the strong correlation, this portends further strength for the EUR/USD. In the meantime, a 4-hour engulfment pattern was negated for the DXY & EUR/USD earlier. Now a potential 6-hour bullish engulfment pattern is developing. Confirmation requires a 1800GMT close above DXY77.097 and follow-through into today's close.

Tuesday, October 12, 2010

10/12: CHART OF THE DAY


The Dow Jones Industrial Average rebounded off 9936 on 27 Aug 2010, completing a zig-zag correction off 10719 (09 August 2010 high). The subsequent rebound has extended to 11032 (08 October 2010 high) so far, matching an equality target (1.0 X 9614/10719 from 9936). This form of symmetry along with daily bearish RSI divergence (comparing the 21 September and 08 October peaks) suggests corrective consolidation is likely to take hold before resuming the underlying trend upwards. While bulls seek a higher low by 10719, short-term strength towards the YTD high at 11250 (26 April 2010) is viable while the 9-day MA supports. Clearing the yearly peak would risk an extension towards 11454 (1.382 X 9614/10719 from 9936). Meanwhile, a move below 10608 (20 September low/near 38.2% of 9936/11032) would suggest further weakness towards 10480 (15 September 2010 low/near 50% of 9936/11032).

STRATEGY: BUY at 10722, risking 10572, targeting 11250

Thursday, October 7, 2010

10/07: CHART OF THE DAY


As I mentioned in yesterday’s post, Dollar weakness was overdue for a correction. Unfortunately, my short USD/JPY position was stopped, as I underestimated post-intervention yen strength. The DXY’s oversold condition has marked a daily bullish hammer reversal that stemmed from EUR/USD’s rejection at the 1.4027 pivot. Gold pulled back and has now potentially confirmed a daily bearish engulfment reversal. The Swissy also pulled back from all-time lows due to a deeply oversold condition and potentially risks a sizeable false-break rebound. The Aussie once again served as a leading indicator after spiking to a 26-year high early in Asian trade before reversing.

While overwhelming evidence suggests a dollar comeback, notice in the above chart that most turning points require the formation of a secondary high or low to complete the trend. As mentioned yesterday, I anticipate a 1-4 day counter-move before resuming trend. Beyond 4 days suggests an intermediate swing is possibly in place and could set up the secondary high or low scenario.

Wednesday, October 6, 2010

10/06: CHART OF THE DAY


TOP 5 Trending Markets:
1. Gold: Yesterday's wide-ranging move suggests the yellow metal is going into a vertical-type exhaustion. Requires a sizeable pullback then a false-break or secondary high before even considering the termination of the uptrend.
2. AUD/USD: Testing the previous high's resistance range. Last correction was the largest in size since bottoming in August. Often a leading indicator of risk, could retest the previous correction base before taking out the .9790/.9840 region.
3. EUR/USD: Breached key Fib retrace, next major pivot is above 1.40. DXY is approaching key 78.6% retracement, which could provide temporary support.
4. USD/CHF: All-time lows reached today, oversold conditions could produce a false-break rebound.
5. Bond Yields: Bearish tone supported by central bank QE. 2-year yields still in falling wedge scenario, while long-end could be supported by possible diverging daily studies could hint of a false-break.

STRATEGY: Nearing short-term correction possibilities for all of the above, which should support the DXY. Look for a 1-4 day counter move to reinitiate US Dollar short positions.


Tuesday, October 5, 2010

BOJ Sends Wrong Message

The Bank of Japan cut interest rates overnight producing a short-lived rally for the USD/JPY. The announcement of a temporary fund to mop up Japanese government bonds and other short-term securities not only disappointed markets, but also sent bond yields lower worldwide.

The diminishing yield differential once again caused speculators to dump the US Dollar, which has been under constant pressure stemming from the Fed’s QE 2 talk. The Greenback’s strong inverse correlation with risk appetite has provided certainty in uncertain markets, leading investors to buy equities and commodities with confidence.

Japan is sending the wrong message. While the yen has been somewhat of an exception to the recent bout of dollar weakness, the Ministry of Finance’s intervention and the BOJ’s announcement are not viewed as a strong enough commitment. As a result, speculators have continued to buy the yen on any dip.

The Japanese should take a page out of Hank Paulson’s playbook, when he got the approval to set up an emergency fund to save Fannie & Freddie. He assured Congress that setting up a sizeable fund was like a bazooka and as long as the market knew one had it, one wouldn’t need to take it out and use it. Paulson’s ploy worked and market nerves were calmed.

The BOJ would also need to adopt a more powerful message in order to weaken their currency. A pledge to provide more QE than any other central bank would provide a well-needed psychological ceiling for the yen. Meanwhile, speculators will continue to nibble at the yen until the Fed hints of reversing its multi-trillion dollar portfolio. This suggests it will take a much more costly intervention until the current Japanese regime learns how to communicate properly with the market.

From a technical perspective, the USD/JPY remains firmly entrenched within a bear market. While the DXY & USD/JPY remain highly correlated since the intervention peak, the yen has not appreciated to the same extent as other foreign currencies vs. the Greenback. While there is a possibility that a marginal test of the pre-intervention low could eventually mark a USD/JPY double bottom, only back above the 86 handle will suggest that a material low is in place.


POSITION: LONG USD/JPY at 83.50, risking 82.70, targeting 85.17

Monday, October 4, 2010

Friday, October 1, 2010

Carry Trade Comeback?


It was nearly 25 years ago in which the United States pleaded with the Japanese to strengthen their currency by intervening in the currency markets. The Plaza Accord was seen then as a measure to help the U.S economy to emerge from a serious recession that began in the early 80’s and alleviate the trade deficit with Japan. It failed miserably because the trade deficit was due to structural issues rather than monetary conditions. While this marked Japan’s emergence as a real player in managing the international monetary system, the recessionary effects of the strengthened yen created an incentive for expansionary monetary policies that led to the Japanese asset price bubble of the late 80’s.

As a result, since the mid-90's, the Bank of Japan has set interest rates at very low levels to fight deflationary affects of an ongoing multi-decade long recession. Due to Japan's export-dependent economy, in order to maintain a weaker currency, the Ministry of Finance intervened selling 35 trillion yen over a 15-month period up to March 2004. This birthed the infamous carry trade, in which investors borrowed at low interest rates in yen and used the proceeds to buy higher yielding assets. Conservative estimates valued the carry trade between $80 billion and $160 billion, but a better estimate of the size of the carry trade was the record of net short positions in yen futures on the Chicago Mercantile Exchange. This put the total size of the carry trade as high as $1 trillion before the so called “trade of the decade” began to unwind.

All good things must come to an end and in the early days of the financial crisis, the carry trade which had flourished is less volatile times began to unravel. As risk aversion increased in 2007, market volatility prompted traders to deleverage and sell their most profitable trades. Another factor that caused the unwinding of the carry trade was the shrinking interest rate differential between Japan and other economies. With most global economies in jeopardy due to the strain of the financial crisis, central banks were forced to cut interest rates. Although, the Bank of Japan had also lowered interest rates, the shrinking differential became too small for the carry trade to compensate against increasing losses as high-yielding assets began to weaken.
Even on the most conservative estimates, the yen's steep rally probably left carry-trading hedge funds with losses of $3.1 billion to $6.2 billion. While the trade-weighted yen remains near all-time highs, risk appetite seems to be making a comeback of sorts. In fact, this past month was the best September for equity markets in the last 70 years. The strong correlation between the S&P 500 and the USD/JPY, which began to decouple towards the end of 2009, looks to have been resolved according to a weekly correlation study (see chart above). This suggests that if equity markets continue to advance, the yen should revert to weakness.

While there are overwhelming expectations for global interest rates to remain low, as long as market volatility remains low there is some evidence that the yen carry trade could soon make a comeback. With Japan’s recent commitment to weaken the yen, the USD/JPY is expected to remain well-bid ahead of the 83 handle. Since intervening two weeks ago, the trade-weighted yen has slowly grinded higher, doubling the amount of time it took to fall from recent highs. As such, a higher low for the USD/JPY is sought near current levels. Meanwhile, the long-term downtrend remains firmly intact while below the 85.87 level, the 25% retracement of the entire move off the 2010 high.

STRATEGY: BUY USD/JPY at current levels, risking 82.70, targeting 85.15