Translation Tool

Thursday, September 30, 2010

09/30: CHART OF THE DAY


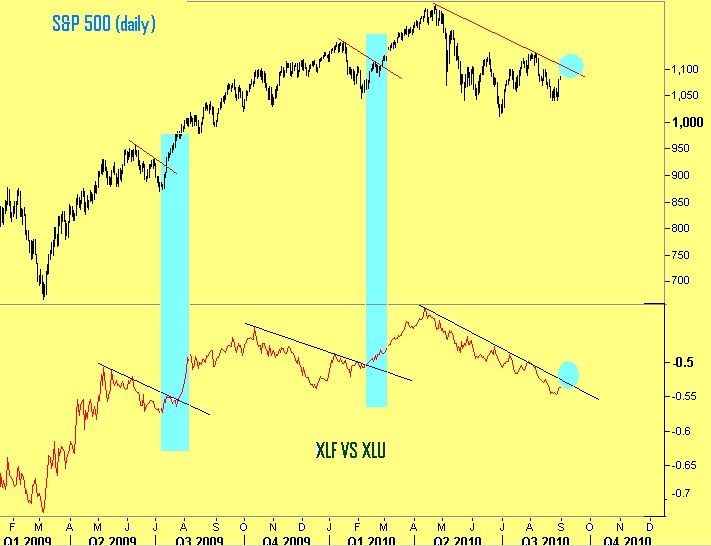
The S&P 500 nearly marked a key reversal day on the back of the false-break of 1150. Bearish divergence also hints of a reversal that will confirm with a daily close below the 14-day moving average. As mentioned in prior posts, the index has been trending in approximate 30-day intervals. It took roughly 30 days from the July base to the August peak, then 30 days back down to the 1040 triple bottom. The current 30-day cycle is near expiration, suggesting a pullback to the 1112/1127 region, a typical sized retracement. A deeper retreat suggests today's high could be an intermediate top and shifts the Elliot wave count lower. Meanwhile, the US Dollar looks to have temporarily bottomed and due to its strong inverse relationship, lends further credibility to the S&P's potential reversal. Keep in mind, that the DXY & EUR/USD would need to break 79.25 & 1.35 to break their current strong 5-week trends.

Wednesday, September 29, 2010

09/29: CHART OF THE DAY


Various equity indices are bumping up against key resistance. The S&P Small-Cap Index falsely broke important support earlier in the month and was a leading indicator. As such, a marginal or failed test of 360 (June/July highs) could set the stage for the broader market to reverse once again. The DXY is probing key support at 78.678 and the S&P 500 has probed key resistance at 1150, but more importantly, both are nearing cycle expirations, which often represents a significant resistance in time.
POSITION UPDATE: LONG USD/JPY at 83.50, risking 82.70, targeting 85.15

Tuesday, September 28, 2010

USD/JPY: Nears key support


The US Dollar Index continues to feel the pain, but relief may soon be in sight. According to the Daily Sentiment Index, the Dollar is at an extreme with only 5% of participants bullish. The Greenback’s oversold condition is evident against its major counterparts when looking at most daily indicators and is now approaching a net $20 billion short position among large speculators (CFTC). More importantly, risk aversion looks like it may be rearing its ugly head again, as seen in recent activity in credit-default swaps, the VIX and bond price-action. While this may not bode well for most traders, the “risk-off” trade tends to benefit the DXY. And with Japan’s recent commitment to weaken the Yen, the USD/JPY is expected to remain well-bid ahead of the 83 handle. Since intervening, the trade-weighted Yen has slowly grinded higher, doubling the amount of time it took to fall from recent highs. As such, a higher low for the USD/JPY is sought near the intersection of a key Fibonacci retracement and a former trendline at 83.50. Meanwhile, the big picture downtrend remains firmly intact while trading below 85.87, the 25% retracement of the entire move off the 2010 high.

STRATEGY: BUY USD/JPY at 83.50, risking 82.70, targeting 85.15

Monday, September 27, 2010

Friday, September 24, 2010

Thursday, September 23, 2010

09/23: CHART OF THE DAY


The EUR/USD has pulled back from overbought conditions, highlighting a clear 5-wave structure off the September low. It is too early to determine whether a large zig-zag correction has been completed or if this is merely the termination of the first wave of a powerful 3rd wave extension. Either way, the anticipated correction is in play and while the EUR/USD consolidates above previous resistance at 1.3157, an extension to 1.35 is favored. This key level is not only the 50% retracement of the November to June decline, but its also a Fibonacci expansion of the June to August advance. If the current pullback exceeds the normal counter-trend length of 3-4 days, then Wednesday's high could represent an intermediate top and the base of the previous 4th wave at 1.3020 could be tested. Keep in mind that the first week of October marks the 4-month anniversary of the 2010 low and could represent significant resistance in time. Finally, since short-term technical studies are not oversold at the moment, I am looking for further weakness to buy into.
STRATEGY: BUY EUR/USD at 1.3181, risking 1.3126, targeting 1.3500

Wednesday, September 22, 2010

GOLD: Continues to ascend to fresh all-time highs


Gold continues to ascend to new heights. While the latest strength has accelerated and risks an exhaustive spike, the advance remains rather orderly. Since bottoming in July, the yellow metal has rallied in roughly 50 point increments then corrected 26 points before resuming the uptrend. Although, there is no clear wave structure, overbought daily RSI suggests a pullback at current levels. The measured correction would take Gold back to the 1270-1275 region before once again resuming strength. A swing low above the previous all-time high set in June would secure the chance of further upside towards the 1316-1320 area, where a cluster of Fibonacci extensions reside.

STRATEGY: BUY GOLD at 1275, risking 1258, targeting 1316

Tuesday, September 21, 2010

VIDEO OF THE DAY

http://www.youtube.com/watch?v=SjclxCa05Jk

I produced this video a little late and since then the S&P 500 has broken above 1131 (the fourth time was the charm!). I'll stick with my breakout target at 1150 to cap gains temporarily. The next important cycle is at month's end. Meanwhile, the DXY broke down further after the FOMC and is nearing the important 80 region. Look for this key pivot to temporarily support. I am looking for a pullback to BUY the S&P 500 and SELL the DXY. Also, I am looking for a deep retracement, possibly 61.8 to 78.6% of the intervention spike to BUY into the USD/JPY. I'll continue to update my trade recomendations once I see technical evidence emerge.

Monday, September 20, 2010

09/20: CHART OF THE DAY


Indices extend to fresh 6-week highs, but some key individual names continue to lag. I am watching the small-caps (SML) at the the key 360 level to judge whether the recovery can last.

Thursday, September 16, 2010

Wednesday, September 15, 2010

US Dollar Index: Confirms Head & Shoulders Pattern


The US Dollar Index has broken below the neckline of a short-term Head & Shoulders pattern. As such, weakness is now anticipated to retest support that held the April & August lows, near the formation’s measured move target. Moreover, the 200-day MA has become resistance, which highlights the inability to reclaim former neckline support. This suggests that weakness could quickly resolve into a bearish thrust to 79.81/80.07 (61.8% retracement/ August low) then briefly recover ahead of a potential final exhaustive decline that would then complete the bear campaign. Meanwhile, reclaiming former neckline support at 81.90 will stabilize and potentially reopen short-term trendline resistance located near 82.70.

STRATEGY: LONG S&P 500 at 1056, risking 1103, targeting 1130
BUY EUR/USD at 1.2938, risking 1.2883, targeting 1.3382

Tuesday, September 14, 2010

09/14: CHART OF THE DAY


STRATEGY: LONG S&P at 1056, (revised) stop at 1103, targeting 1130

Monday, September 13, 2010

Friday, September 10, 2010

09/10: CHART OF THE DAY


STRATEGY: LONG S&P 500 at 1056, risking 1070, targeting 1130
LONG USD/JPY at 83.72, risking 83.72 (revised), targeting 84.72

Thursday, September 9, 2010

Wednesday, September 8, 2010

S&P 500: Pauses at trendline resistance


Overly pessimistic bullish sentiment (according to the AAII survey) and oversold daily conditions have provided the catalyst for the S&P 500’s latest rebound, highlighting the completion of wave 2’s symmetrical zig-zag correction off the August highs. This sets up a possible powerful 3rd wave-rally that could extend towards the year-to-date high. While trendline resistance (originating from the August peak) has temporarily stalled the move, bullishly diverging hourly studies indicate support at a relatively high level.

In addition to bullish price-action, the S&P 500 is trading in a 15-day cycle with turning points every 15 calendar days or so. This suggests that the current rally should endure through the middle of next week barring some unforeseen event. As such, there is ample room for the market to extend the rebound, given daily studies are not quite overbought at the moment.

While the key 14-day moving average remains supportive (on a closing basis) and once trendline resistance is cleared, obvious resistance at 1130 is next targeted. A failure to retest this important pivot could put the entire recovery at risk and could alter the current Elliot wave count.

STRATEGY: LONG S&P 500 at 1056, risking 1070 (revised), targeting 1130 (revised)

09/08: CHART OF THE DAY


Tuesday, September 7, 2010

09/07: CHART OF THE DAY


DXY: September seasonally a weak period

Thursday, September 2, 2010

09/02: CHART OF THE DAY


Since the April highs, the XLU (the Select Utility Sector Spider) has been the leading sector while the XLF (the Select Financial Sector Spider) has lagged. The relative strength comparison has ticked up as of late, but remains entrenched within a bearish downtrend. Consequently, a break of trendline resistance would confirm a resumption of the bullish campaign that originates from the March 2009 trough. This would trigger the S&P 500 to break key resistance near the 1100 region back towards the April highs.

STRATEGY: LONG S&P 500 at 1056, risking 1039, targeting 1100